
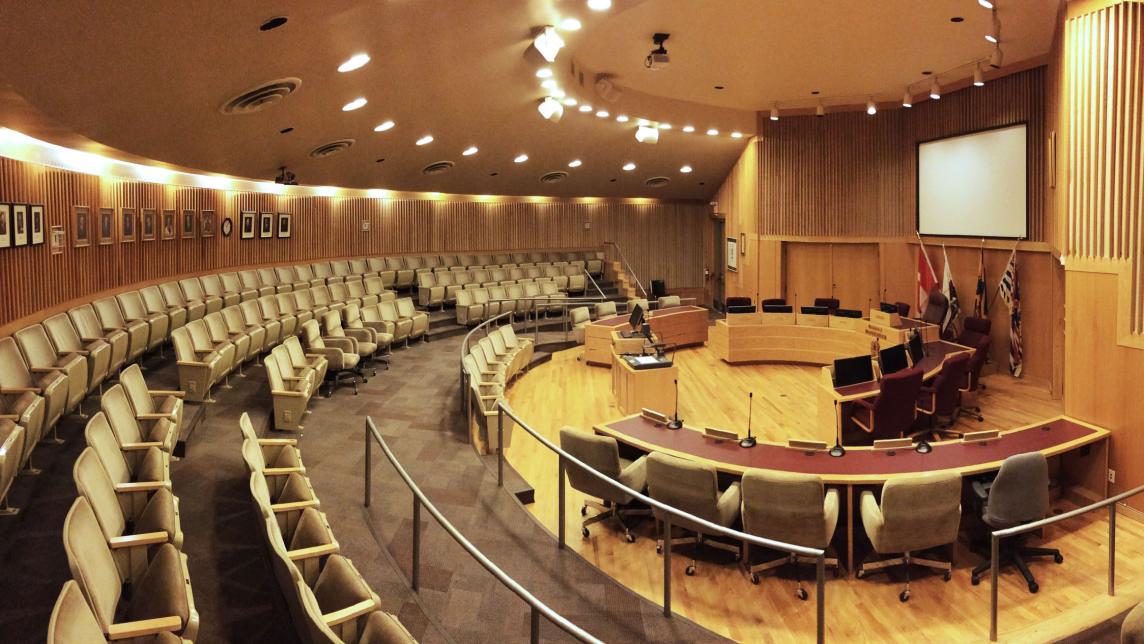
Inaugural Council Meeting
Council will be inaugurated in a ceremony on Tuesday, November 3, 2026 at 6:00 p.m. at the ACT Arts Centre. The ceremony will be followed by a Regular Council meeting.
Official Results for Councillors
(Six elected)
| Candidate | Total | % Vote |
|---|---|---|
| DUECK, Judy | 9,418 | 9.00% |
| MEADUS, Chelsa | 9,403 | 8.98% |
| D'EITH, Bob | 8,763 | 8.37% |
| MORDEN, Mike | 8,323 | 7.95% |
| CARRERAS, Korleen | 7,387 | 7.06% |
| LAITY, Andrew | 7,371 | 7.04% |
| KOEHN, Leanne | 7,116 | 6.80% |
| MITROVIC, Inya | 6,894 | 6.59% |
| SVENDSEN, Ryan | 6,877 | 6.57% |
| BROWN, Kristina | 6,077 | 5.81% |
| JOHAR, Bhupinder | 6,075 | 5.80% |
| STEPHENSON, Cindy-Lea | 5,111 | 4.88% |
| HOLLAND, Ken | 4,519 | 4.32% |
| JOSE, Lou | 4,441 | 4.24% |
| MUISE, Steven | 4,080 | 3.90% |
| CAMPBELL, Leah | 2,809 | 2.68% |
Official Results for School Trustees
(Five elected)
| Candidate | Total | % Vote |
|---|---|---|
| YAMAMOTO, Elaine | 8,722 | 11.97% |
| MURRAY, Mike | 7,284 | 10.00% |
| BAILEY, Mark | 6,203 | 8.51% |
| SHAW, Pascale | 4,985 | 6.84% |
| MONTGOMERY, Jacquie | 4,958 | 6.81% |
| DAVIDSON, Paul | 4,866 | 6.68% |
| TONES, Brad | 4,523 | 6.21% |
| TRUDEAU, Nicole | 4,462 | 6.12% |
| WARNER, Crystal | 4,367 | 5.99% |
| HAUGEN, Emily | 4,221 | 5.79% |
| STROMGREN, Jeff | 3,732 | 5.12% |
| REDKWICH, Karen | 3,203 | 4.40% |
| SANDVE, Chris | 3,062 | 4.20% |
| BISSESSUR, Deepa | 3,001 | 4.12% |
| AHMADIAN, Kourosh | 2,799 | 3.84% |
| ALLENBUCKLE, Aidan | 2,467 | 3.39% |
Preliminary Assent Vote Results
Total number of “Yes” and “No” votes received for each Assent Vote question. A question passes if more than 50% of valid votes cast are Yes.
| Hammond Aquatics & Recreation Centre | ||
|---|---|---|
| Yes Votes | 6,841 | 32.48% |
| No Votes | 14,218 | 67.52% |
| Hammond Multi-Use Community Park | ||
|---|---|---|
| Yes Votes | 6,209 | 29.56% |
| No Votes | 14,797 | 70.44% |
| Albion Twin-Rink Arena Expansion | ||
|---|---|---|
| Yes Votes | 9,501 | 45.13% |
| No Votes | 11,553 | 54.87% |
View Full Official Election Results
See detailed Election Results, including results by polling station, mail votes, and advance voting.
Voter Turnout
0 Total Ballots Cast
Voter Turnout
A total of 21,612 ballots were cast in the 2026 Local General Election, representing voter turnout of approximately 30.18 per cent of eligible voters, an increase of 49.1 per cent over the 2022 election.
For comparison, 14,491 votes were cast in the 2022 Local General Election, representing a voter turnout of approximately 21.87 per cent. Voter turnout in 2018 was approximately 33.5 per cent. Total ballots cast in 2022: 14,491, representing a voter turnout of approximately 21.87% . Voter turnout in 2018 was approximately 33.5%